


TRUSTED BY
Most operators know that technical service performance contributes 20-30%* of their total NPS. Yet, traditional scoring methods fail to provide the granular data needed to actually improve network quality or accurately predict customer perception.
Subtonomy ActiveNPS changes that. It directly correlates subjective customer NPS scores with objective service quality KPIs, customer location, and device performance. By turning feedback into actionable technical data, you can finally verify the impact of network investments and proactively fix the issues that matter most to your customers.
*Svenskt Kvalitets Index: Mobiloperatörer 2020.


Technical service delivery accounts for 20-30% of the customer satisfaction.

Why Active NPS? Correlate NPS with service quality
With ActiveNPS application is possible to measure the correlation between the actual service delivery and the perceived quality of service. By continuously sending out SMS to pinpointed or randomly selected customers, the perceived service delivery can be measured and followed continuously for a longer period of time, to plan improvements. For example, this can be helpful in identified areas to measure the perceived service delivery before and after a network improvement work in that particular area.
Correlate sentiment with reality
Stop guessing why your NPS fluctuates. ActiveNPS creates a direct, real-time link between subjective customer feedback and objective network performance. By correlating individual IMSI data with technical KPIs, such as paging success, throughput, and technology shifts (2G-5G), you gain a definitive understanding of how network health directly dictates customer loyalty. It’s no longer about if the network is working, but how it is perceived.
Customer impact & prioritization
Generic feedback leads to generic fixes. ActiveNPS utilizes geographic intelligence to visualize sentiment on a granular map. By mapping NPS scores to specific cell sites and clusters, your technical teams can move with surgical precision. This allows you to prioritize infrastructure investments where they will yield the highest uplift in satisfaction, turning "problem areas" into high-performing assets based on real customer movement and experience.
Validate investments and device performance
Every network upgrade or device rollout is an investment, ActiveNPS allows you to prove it works. By comparing NPS data before and after network enhancements, you gain a clear "before-and-after" picture of your ROI. Furthermore, by isolating performance by specific device models, you can identify whether a dip in satisfaction is a network failure or a hardware-specific issue, allowing for more targeted customer support and marketing communication.
Move from reactive fixing to proactive optimization
Don't wait for the quarterly report to find out your customers are unhappy. With daily service-level measurements and continuous reporting, ActiveNPS provides a pulse on your subscriber base. This allows your teams to identify emerging trends and resolve service degradations before they escalate into churn, ensuring your brand promise of "superior connectivity" is met every single day.

Real-time insights into Customer Satisfaction
Powerful Analytics for Modern Networks

Continuous NPS analytics: track, measure, and optimize customer satisfaction
Gain a real-time pulse on your customer base with the ActiveNPS overview dashboard. This centralized reporting hub provides a continuous stream of sentiment data, empowering teams to track performance against strategic KPIs with precision.
By aggregating feedback into daily, weekly, or monthly views, the platform offers a granular look at the volume of promoters, neutrals, and detractors, alongside your overall approval rating. With intuitive filtering by score and time period, you can quickly isolate trends, verify the impact of network changes, and ensure your customer experience goals are consistently met.

Plan network enhancements
Visualize customer sentiment with an interactive map that uses intuitive color-coding to highlight Promoters (green), Neutrals (yellow), and Detractors (red) across your footprint.
Navigate from a global network view down to specific cell-level clusters, applying filters for technical KPIs like CS and PS failures to pinpoint the root cause of poor experiences.
This visual intelligence simplifies planning by correlating performance data directly with geographic locations to verify the impact of network enhancements.
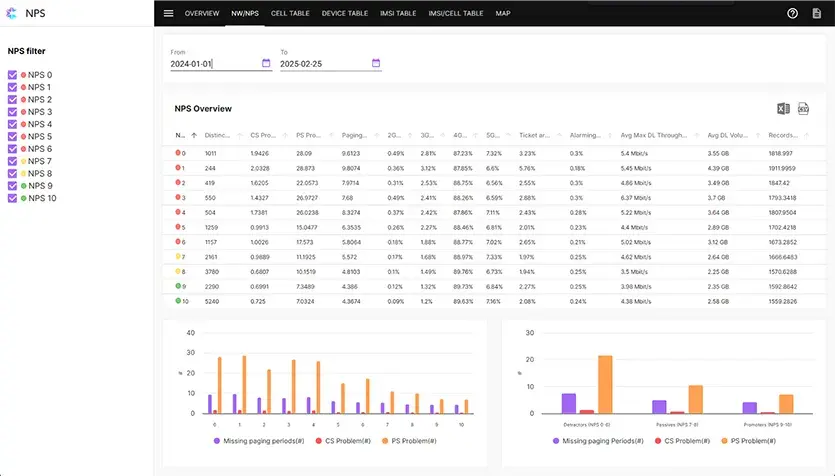
Correlating NPS with technical reality
Bridge the gap between customer perception and network performance. The NW/NPS view maps surveyed IMSIs directly to measured service quality , revealing how critical KPIs, including throughput, technology use (2G-5G), and network incident rates, drive customer satisfaction.
By visualizing the clear correlation between NPS scores and technical failures, such as CS/PS problems or missing pagings, you gain the data-driven insights needed to verify service quality and optimize the customer experience.


FAQ: Optimizing network planning and improve Customer Satisfaction with Subtonomy ActiveNPS
Your Questions, Answered.
We understand that telecom tech support and service assurance involves complex technical, legal, and security details. To provide clarity, we've gathered straightforward answers to the most common questions about the ActiveNPS application and the Subtonomy platform.
ActiveNPS bridges the gap between subjective feedback and objective reality by mapping individual SMS survey responses (IMSI-level) directly to real-time network performance data. By correlating scores with technical metrics such as throughput, paging success, and CS/PS failures, operators can identify exactly which service quality issues are driving detractor scores and which improvements lead to promoters.
Yes. ActiveNPS features a high-resolution GEO-mapping interface that visualizes sentiment across your entire footprint. You can zoom from a nationwide overview down to specific cell clusters to see where Detractors (red), Neutrals (yellow), and Promoters (green) are concentrated. This allows you to pinpoint geographical "pain points" and prioritize site-specific enhancements where they will have the most impact.
ActiveNPS is a powerful tool for verification. By using the "before and after" comparison feature, you can measure the specific impact of a network upgrade or infrastructure investment on customer sentiment. This provides clear evidence of ROI, proving how technical improvements directly translate into higher customer satisfaction and increased loyalty.
The platform monitors a comprehensive range of KPIs that influence perceived quality, including Packet Switched (PS) and Circuit Switched (CS) problems, missing pagings, average throughput, and network incident affect rates. It also analyzes performance across different technologies (2G, 3G, 4G, and 5G) to ensure a consistent experience across the entire network.
Absolutely. Because ActiveNPS maps feedback to the specific device model used by the subscriber, you can isolate hardware-related performance issues. This helps distinguish between network-wide degradations and handset-specific problems, enabling more accurate troubleshooting and targeted marketing or support communications.
ActiveNPS provides continuous reporting based on daily SMS surveys sent to randomly selected customer groups. This move away from static, quarterly snapshots allows you to track sentiment trends in real-time and respond proactively to emerging issues before they impact your overall brand reputation.

Transform your Telecom Operations today
Get your personalized demo
Alarms are just noise without context. We'll show you how to find the signal.
Fill out the form for a tailored demo and see exactly how our real-time geographical map and ML-powered anomaly detection can help you prioritize based on real customer impact, slash resolution times, and empower your 'operations heroes'.
We'll also show you how our ML platform and integration-ready APIs can share this vital network-impact data with your customer support teams and existing 3rd-party systems.