
BrandDash - Proactive IoT, MVNO and Brands Analysis & Reporting
Build Trust. Guarantee Service Quality. Grow Revenue.
The European MVNO market is projected to reach EUR 124 billion by 2031. To capture your share, you need more than just a network — you need total visibility and transparency. BrandDash equips you to manage, support, and grow your partnerships with a single, powerful analytics platform.

OUR CLIENTS
We believe every client is a valuable long-term partner.


Essential analytics for exceptional wholesale support
In the competitive wholesale telecommunications landscape, delivering premium support cost-effectively is non-negotiable. BrandDash provides the pivotal insights and analytics you need to manage and enhance network performance for your MVNOs, MNO sub-brands, IoT partners, and even regulators. Our platform simplifies monitoring, visualizes key performance indicators, and ensures you maintain competitive service levels across your entire brand portfolio.


A single Platform for all your stakeholders
A successful wholesale operation requires managing the unique needs of diverse partners. BrandDash delivers tailored, granular insights for every part of your ecosystem, turning complex network data into clear, actionable intelligence.
For MVNOs partners
Empower your partners with the transparency they crave. Give them a dedicated view of their own performance, from regional service quality and data trends down to the specific handset models causing customer friction. This builds trust, reduces their support burden, and helps them manage their customer experience effectively.
For internal brand managers
Manage your entire portfolio with precision. Use the "traffic-light" overview to instantly assess the health of every sub-brand. Compare top and worst performers to ensure your premium brands deliver a premium experience, and use detailed Mean Opinion Score (MOS) and drop-rate data to protect brand integrity across all segments.
For your sales & account managers
Turn analytics into revenue. Equip your sales teams with concrete data to identify upsell opportunities. Stop revenue leakage. Identify unauthorized use of bandwidth, 5G, or subscriber numbers outside of active contracts. Show a partner which applications (e.g., video streaming) are dominating their data volume to sell them a higher-tier plan, or use handset performance data to identify partners who would benefit from 5G roaming packages.
For your network & operations teams
Go beyond simple alarms. Use the "Worst Performing Brands" list to prioritize optimization efforts. Drill down with detailed map clusters to find the root cause of regional issues, whether it's high call setup time, data drops, or paging fails — before they impact your partners.
For your IoT & B2B managers
Monitor what matters for machines. Go beyond consumer metrics to track the specific KPIs for your IoT clients. Visualize fleet locations with map clusters and track key metrics like mobility (paging success) and data setup fails to guarantee rock-solid reliability for critical B2B services.
From high-level overview to root-cause analysis
BrandDash gives you the power to see everything. Start with a portfolio-wide summary and, in just a few clicks, drill down to the specific handset, application, or network cluster causing an issue.

Centralized brand health overview & prioritized performance rankings
Get an instant, portfolio-wide summary. Our "traffic-light" dashboard (red/yellow/green) shows you the real-time health of every brand across all key services: voice, data, SMS, paging, and mobility compared to the network average. Instantly spot and prioritize the brands that need attention.
Focus your efforts where they matter most. Get an automatic, ranked list of the worst-performing brands based on subscriber count, data attempts, data drops, drop trends, and data volume. Proactively support partners before minor issues become a reason to churn.

Deep-dive handset & MOS analytics
Stop guessing. Pinpoint the root cause of poor customer experience by correlating performance by handset. Identify the worst-performing devices and see why they are failing — from voice/data drops and setup fails to high re-dials, slow call setup time, and low Mean Opinion Scores (MOS).

Geographic map & regional clustering
Visualize your entire network service footprints. Drill down from a national overview to detailed map clusters to spot network events and potential errors in real-time. Filter by service type (voice, data) and technology (4G, 5G) to pinpoint issues, and instantly compare your top and worst-performing regions to ensure consistent quality of service.
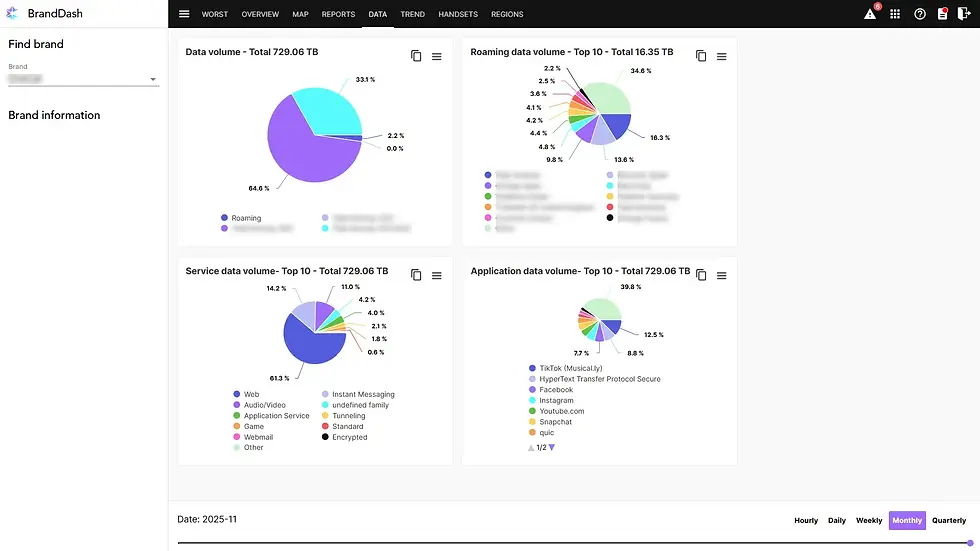
Granular data & application analysis
Understand how your network is being used, brand by brand. Go beyond total data volume to see the full breakdown: roaming data, service data (like streaming), and even application-level traffic. Track uplink/downlink trends to manage capacity and identify new commercial opportunities.

We know just how important it is not being blind to the performance of a specific brand in relation to the entire network and the contract. BrandDash gives all stakeholders the transparent analytics and reporting tools to take your wholesale business to the next level.
Fredrik Edwall
SVP Sales & Marketing Subtonomy
See also: CorpDash for Enterprise Customers
Don't just take our word for it. See how leading telecom operators are using the CorpDash application to empower their teams, reduce costs, and deliver first-class care. Explore these highlights below or see all our customer cases for more.


Supercharge your Customer Support today
Get your personalized demo
Customer expectations move fast. We'll show you how to keep pace. Fill out the form for a live demo and see exactly how our AI agent assist and network-aware diagnostics can help you boost FCR, cut AHT, and empower your 'support heroes'. We'll also show you how SubSearch can plug into your existing tech stack with our integration-ready APIs.